Systematic swing trading · US stocks · your own account
Your PC. Your brokerage account.
One decision a day at 3:55 pm New York time.
Nexus Trader is a rules-based swing-trading program that runs on your own computer, in your own Interactive Brokers account. You keep the account and the money. The software places the orders and manages the stops. Nexus never holds, accesses, or controls your funds.
Simulated results — not actual trading and not a forecast. The full context, charts, and every caveat →
Free on your paper account — for as long as you want. Run it in Interactive Brokers' simulated mode with no card and no time limit. You pay only if you decide to go live with real money.
Performance — simulated, with the full context
June 2021 to September 2026, simulated and published in full
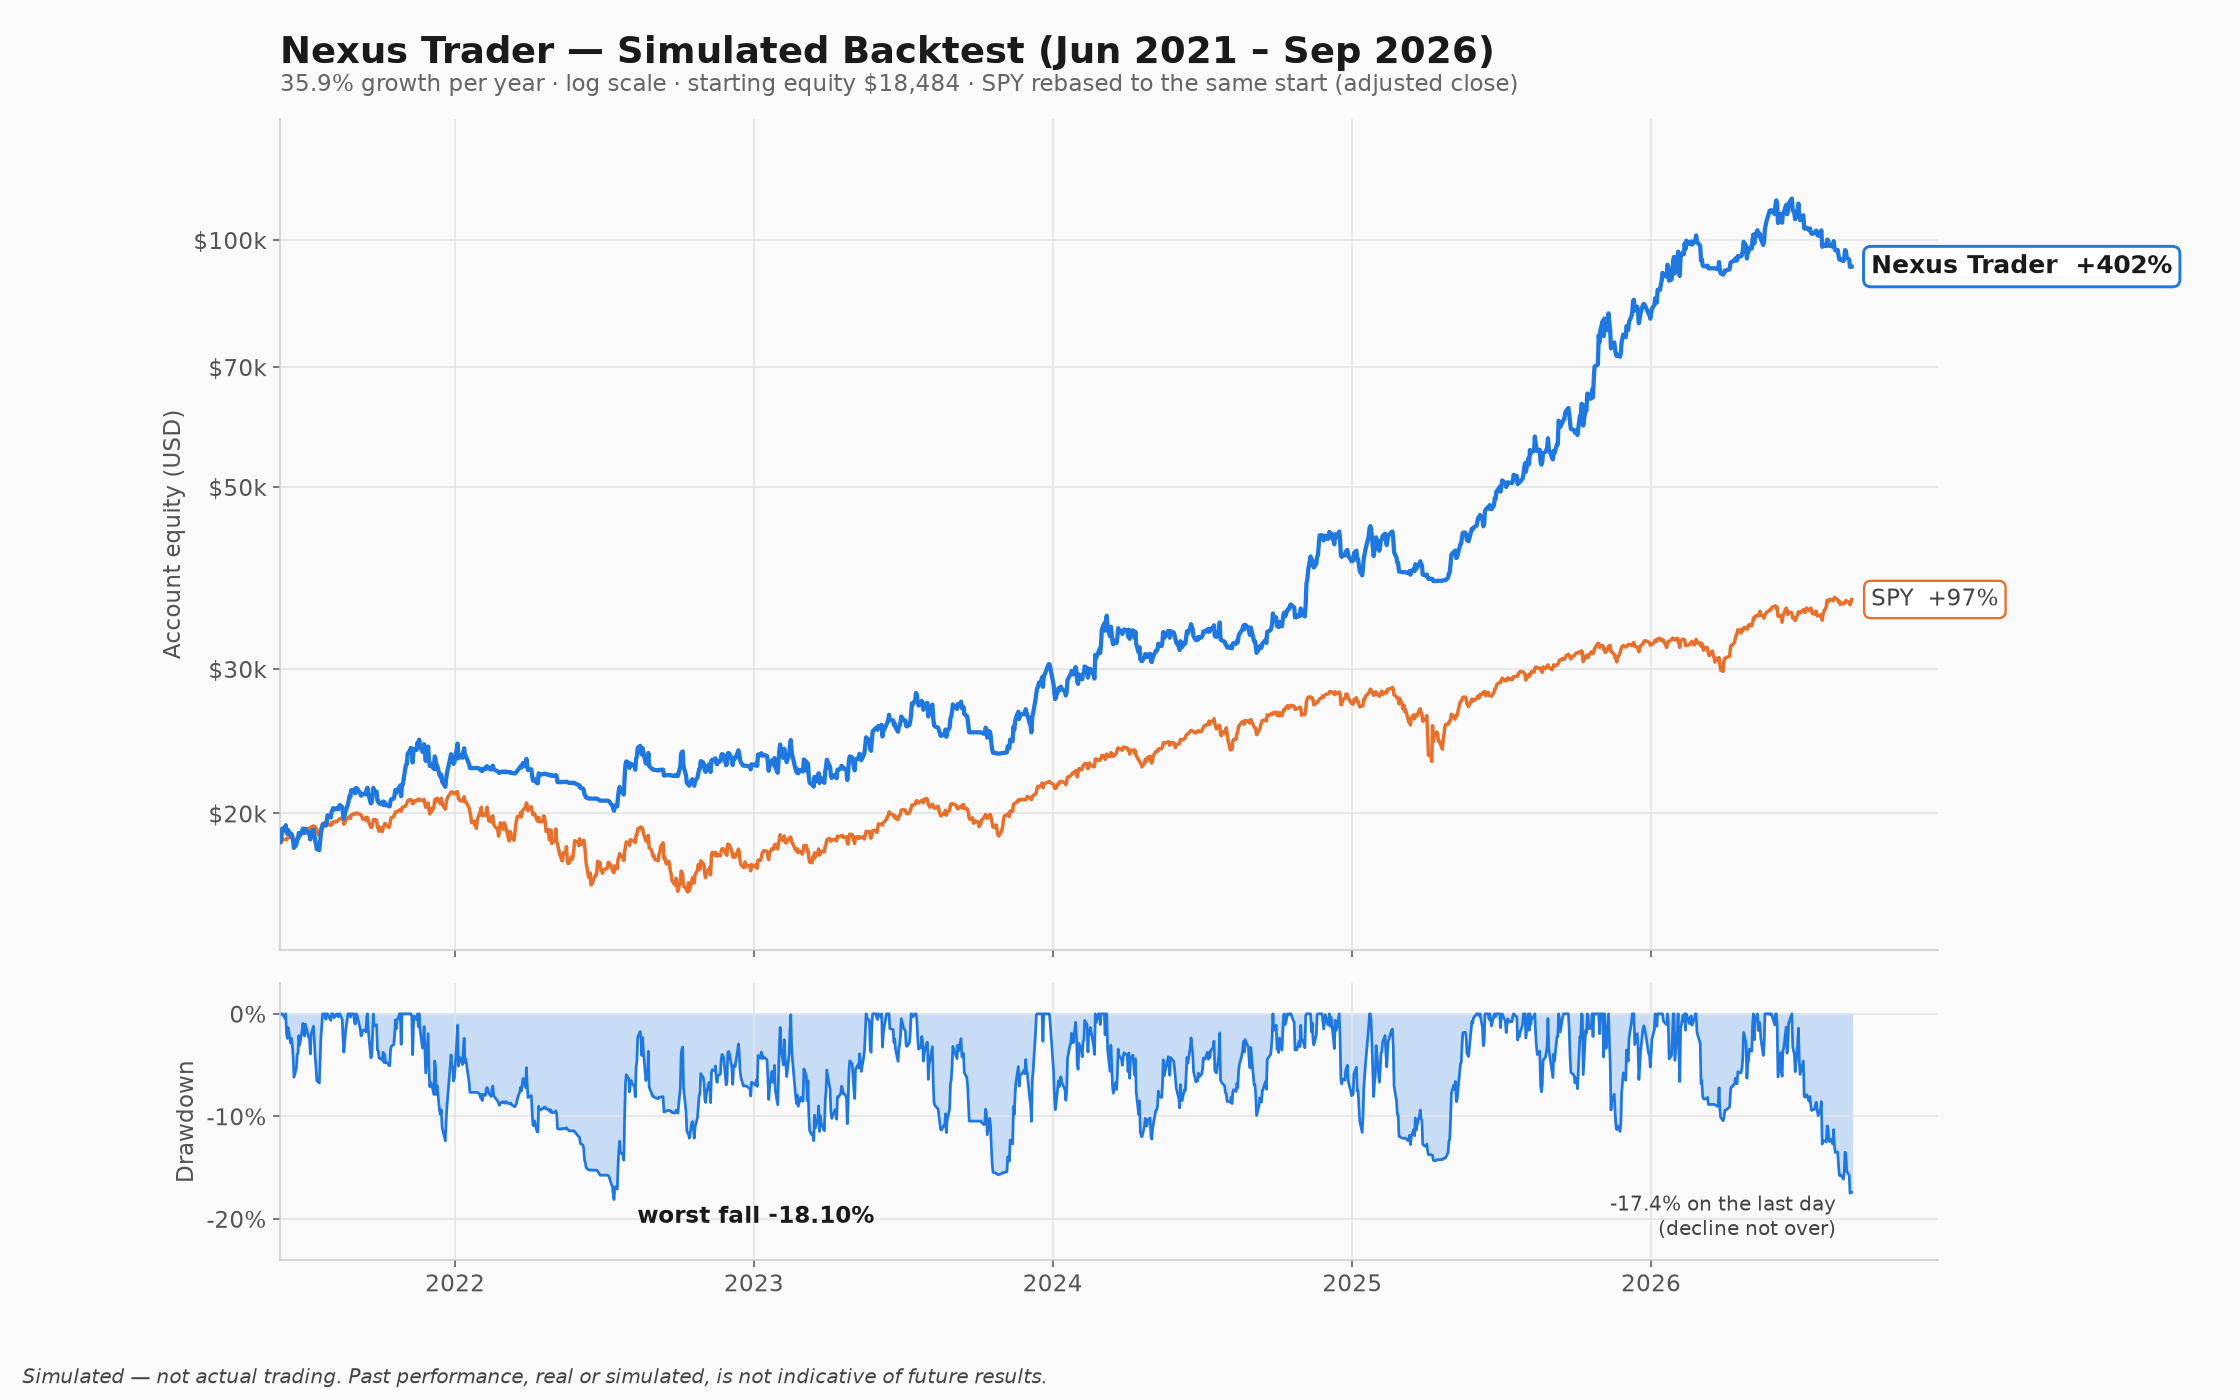
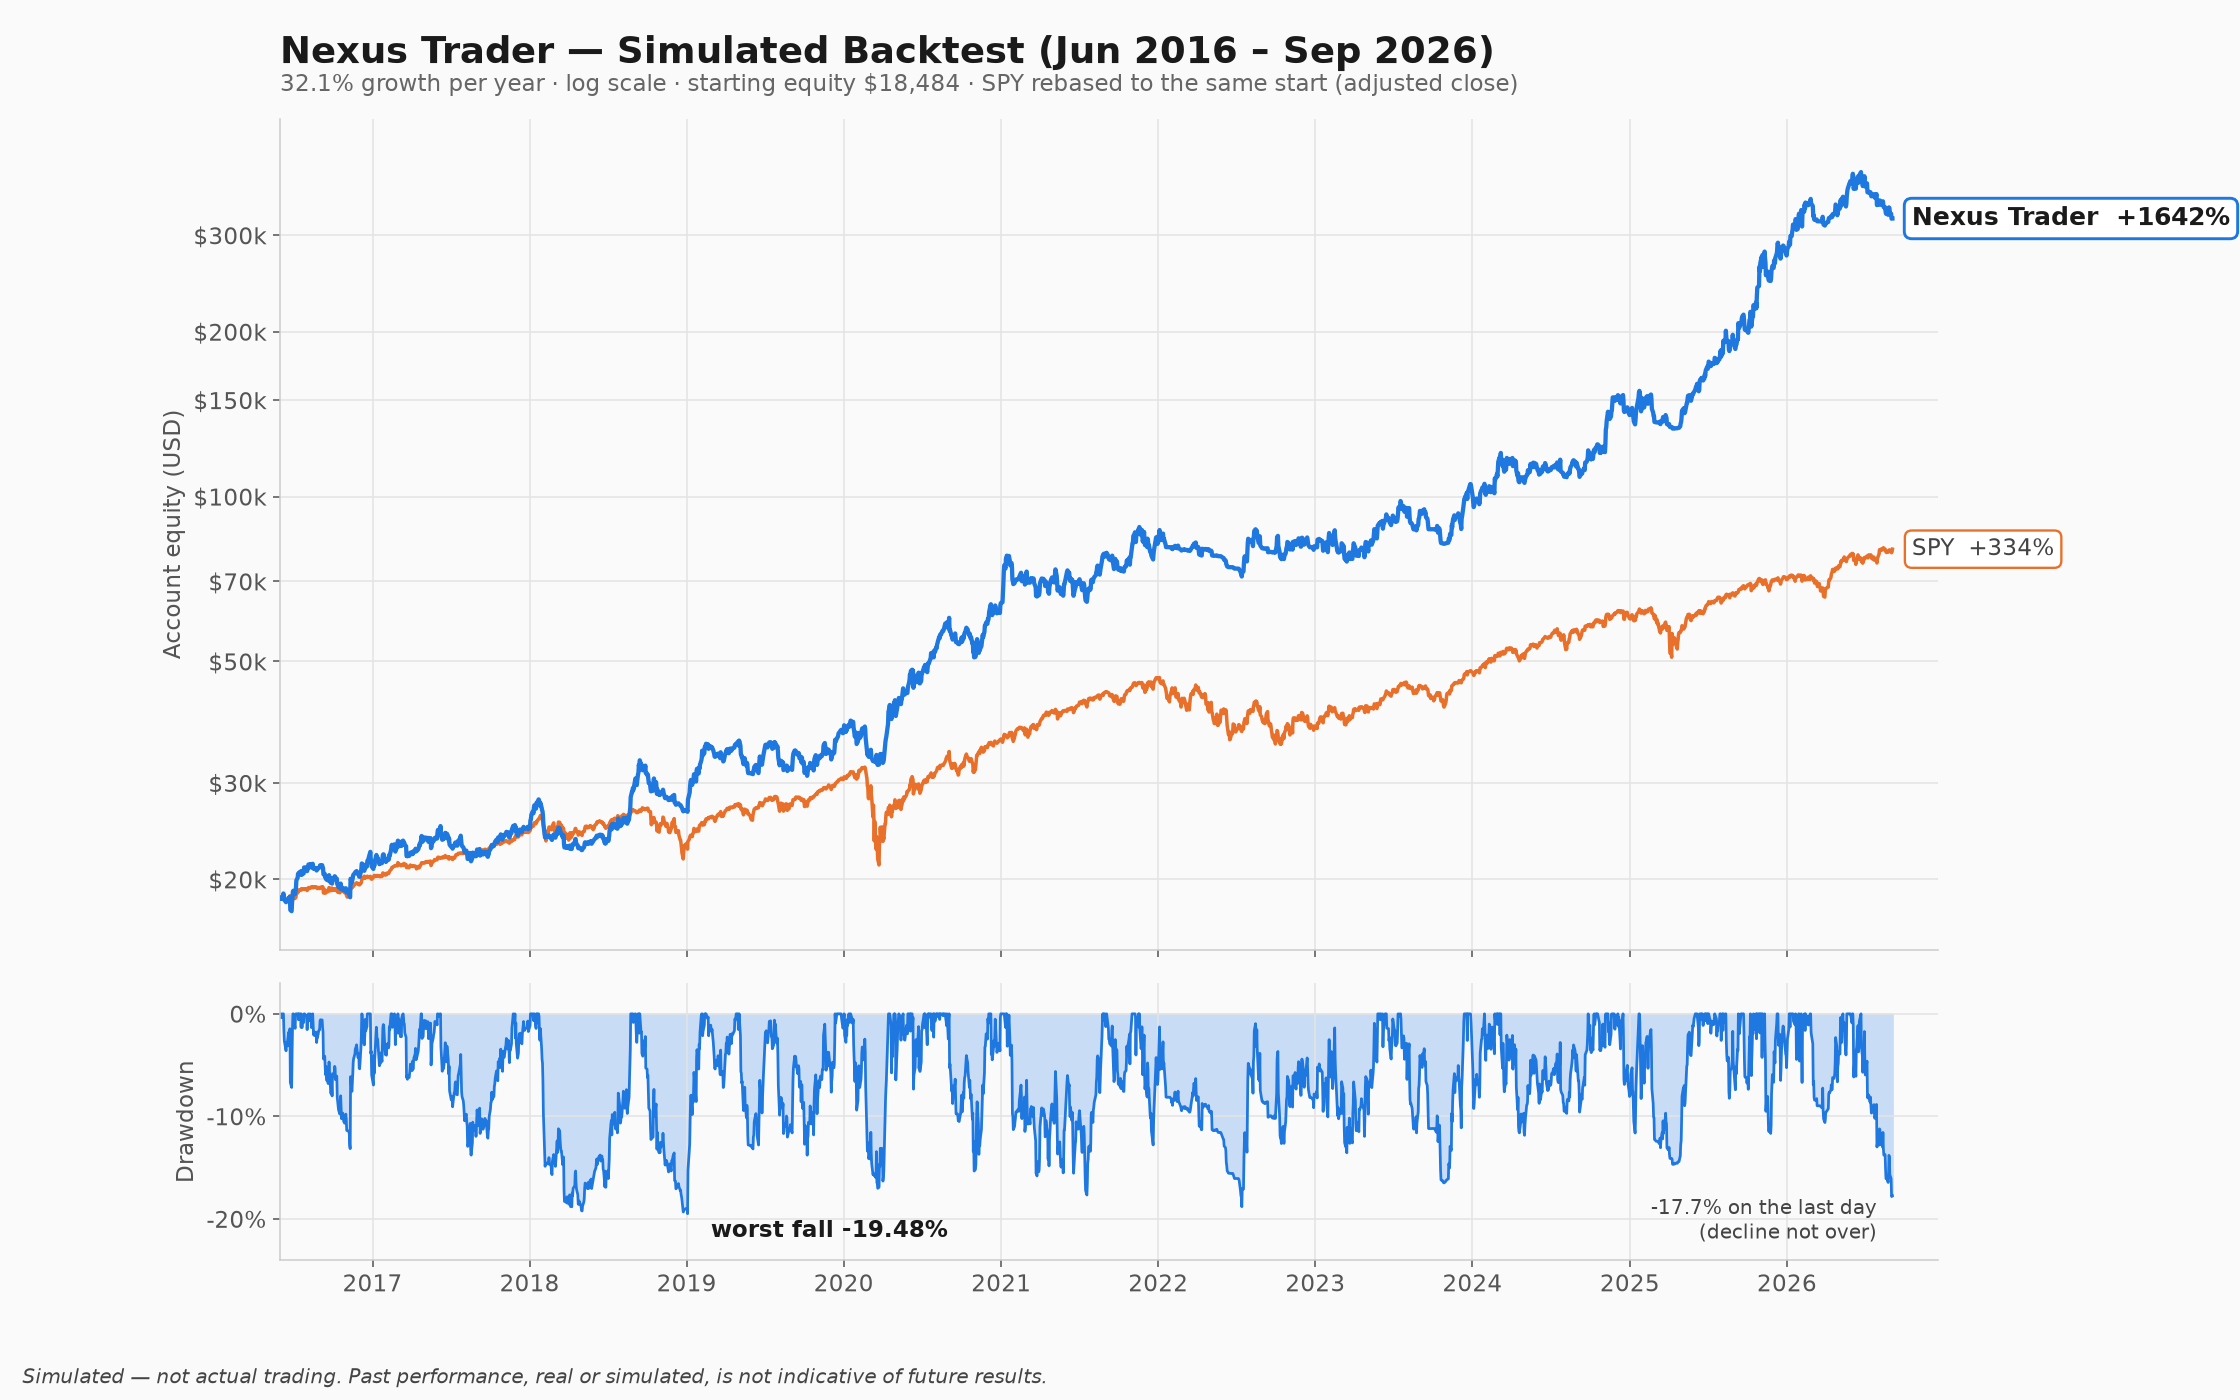
One headline window, one uniform data set, run all the way through the summer of 2026, no cherry-picking — and every closed trade in it published, so you can check the work yourself. A ten-year check of the same rule sits beneath it, with its own caveats. These are simulations; the context beside the chart is part of the record, not fine print.
| Window | Total return | Growth per year | Worst fall | Closed trades | SPY same window |
|---|---|---|---|---|---|
| Jun 2021 – Sep 2026 (2021-06-01 to 2026-09-03) | +402.1% | 35.9% | −18.10% | 1,024 | ≈ +97% |
| 10 years (Jun 2016 – Sep 2026)* (2016-05-31 to 2026-09-03, ten-year check) | +1,641.6% | 32.1% | −19.48% | 1,943 | ≈ +334% |
* Ten-year check, revised 9 September 2026. The same configuration run from June 2016 with the same data conventions, published beside the five-year headline and not as the headline. Over the ten years: 1,943 trades, win rate 22.6%, average winner $1,482 against −$255 per losing trade, longest run without a winner 41 trades, longest stretch below a prior peak 379 trading days — about 18 months (November 2021 to May 2023); calendar years (each year measured year-end over prior year-end) 2016 (June–December) +14.2% · 2017 +17.0% · 2018 +8.3% · 2019 +38.4% · 2020 +72.7% · 2021 +28.7% · 2022 −1.3% · 2023 +28.7% · 2024 +35.0% · 2025 +95.6% · 2026 (to 3 September) +16.8% — one losing year. Four caveats travel with it. (1) Universe look-ahead: the scanner history stamps today's stock universe across the past because historical snapshots do not exist; about a fifth of the 2016–2018 names were chosen with knowledge that did not exist at the time. This inflates the ten-year return and matters little after 2021. (2) The margin to 25%: about five points on this path and four and a half in the seeded re-runs; the deepest fall in any run of this configuration was −20.51%, and every one of its 19 runs stayed inside 25% — none of which makes a backtest a forecast. (3) One history, still in a fall on the last day: the 2026 decline had not ended when the data ended, and a different decade, or the same decade with a few different fills, can produce a deeper fall. (4) Not stitched to the five-year run: the ten-year run passes through June 2021 with an account and open positions of its own (it held 13 positions on 1 June 2021), so its last five years are not the same path as the five-year run above; the two are not stitched and neither is quoted as the other. The trade list and CSVs on this page are the five-year window's.
These figures describe the configuration adopted on 9 September 2026: the position-sizing rule chosen after the live account's summer loss, plus an entry rule — the load day, on which the strategy buys its Nasdaq-listed watchlist names when the Nasdaq-100 index fund closes on one of its anchored price lines — chosen from a study the operator requested, in which more than sixty configurations were compared on this same history. Both studies are on the Research page. The figures are simulated, drawn from a single history that was still in a decline on its last day, and are floors rather than limits.
The same rule under stress
| Scenario | Worst fall | Growth per year |
|---|---|---|
| Published run ($18,484 starting account) | −18.10% | 35.9% |
| $7,000 starting account | −17.82% | 36.2% |
| $12,000 starting account | −17.61% | 37.2% |
| $25,000 starting account | −18.27% | 36.4% |
| $40,000 starting account | −17.85% | 35.9% |
| Bad fills (every stop-loss that gaps overnight fills at the next open instead of at the stop price) | −20.00% | 30.8% |
In 19 paired tests against the previous configuration — five account sizes, bad fills, a ten-year run and twelve seeded re-runs — the adopted configuration grew faster in all 19 and had the shallower worst fall in 18; its deepest fall in any of them was −20.51%. Simulated.
How the configuration behaved in past falls
From the ten-year check: the deepest drop from the running high inside each window, for the configuration adopted on 9 September 2026 and for the previous configuration (adopted 5 September, no longer offered). A load day buys whatever the market regime says, so the current configuration falls further in a fast crash and less in a slow decline. Simulated.
| Episode | Window | Adopted configuration (9 September) | Previous configuration (5 September, no longer offered) |
|---|---|---|---|
| Late 2018 (worst fall of the decade) | 2018-09-14 → 2019-01-03 | −19.48% | −16.22% |
| March 2020 | 2020-02-19 → 2020-03-23 | −14.91% | −11.42% |
| 2022 | 2022-01-03 → 2022-10-12 | −17.75% | −13.35% |
| Summer 2026 | 2026-05-11 → 2026-09-03 | −17.81% | −20.06% |
| The 2019 slide | 2019-05-03 → 2019-12-03 | −13.78% | −23.31% |
The 2019 slide ran seven months in a market that rose (S&P 500 about +6% over the same months): the previous configuration fell −23.31% in it, the adopted configuration −13.78%. The fourth quarter of 2018 is the other side of that coin: a fast fall in which the adopted configuration, still buying on its load days, fell −19.48% against −16.22%, and that is its worst fall of the decade. In March 2020 it fell −14.91% against −11.42%. The "2022" row is the market's bear-market window; the five-year run's own worst fall, −18.10%, is the longer slide from 18 November 2021 to 14 July 2022, and the ten-year run regained its 2021 peak in May 2023, about 18 months later.
The context that travels with those numbers
- Win rate 22.4%. About 1 trade in 4 or 5 wins (229 of 1,024); the rest lose a small amount. The average winner was $677 against −$103 per non-winning trade — about 6.0× the average losing trade — and the top ten winners carried 73% of net profit. Profit factor 1.89; biggest single win $11,783, biggest single loss −$677. The edge is a right tail, not a hit rate.
- Losing streaks: the longest simulated run without a single winner was 32 consecutive trades, and 14% of all 22-trade windows contained at most one winner.
- Live record: the live record is short (real money since July 2026) and includes a loss of about a quarter of the account over the summer of 2026; the study on the Research page explains what caused it and what changed. Monthly statements are available on request.
- Time under water: the longest stretch below a prior equity peak was 373 trading days — about 18 months (November 2021 to May 2023). The worst two months (44 trading days) lost 15.7%. New highs come in bursts, and most of the simulated gains arrived in 2025.
- There is a losing calendar year: 2021 (June–December) +24.8% · 2022 −0.5% · 2023 +31.2% · 2024 +34.8% · 2025 +97.6% · 2026 (to 3 September) +15.7%.
- Still falling on the last day: the 2026 decline from the 22 June peak had reached 17.48% by 1 September and had not ended when the data ended on 3 September. The −18.10% worst fall is one sample from one path; a different five years, or the same five years with a few different fills, can produce a deeper fall.
- Chosen on the history it is judged on: the position-sizing rule behind these figures was selected in September 2026 after the live account's July–September loss, and the load-day entry rule was chosen from more than sixty configurations tested on this same history, so part of its margin is selection. Its out-of-sample record starts only when it goes live.
- It buys while the market is falling: a load day ignores the market regime, so in the fast crashes of the ten-year check this configuration fell further than the previous one (−19.48% against −16.22% in late 2018; −14.91% against −11.42% in March 2020), and in the slow declines it fell less (−13.78% against −23.31% in the 2019 slide; −17.81% against −20.06% in the summer of 2026).
- Universe caveat: the stock universe uses a current-day snapshot (historical snapshots do not exist), which can flatter the earlier years of the window.
- Stop-fill convention: the simulation fills stops at the stop price. Live, stops are monitored in extended hours from 04:00 ET, and real fills can be worse than the stop in thin pre-market conditions — the bad-fills row above is the published figure for that scenario, and live falls can exceed the simulated figures.
Check the work
Every closed trade from the simulation is published — entry, exit, size, profit or loss, and the exact rule that closed it — along with the day-by-day equity series. Real-money operation runs since July 4, 2026 in the operator's own account, with monthly statements from July 2026 onward.
Raw data: daily equity, Jun 2021 – Sep 2026 (CSV) · all 1,024 trades (CSV)
Backtested results are simulated. They do not represent actual trading and do not account for all market conditions or costs. Past performance, real or simulated, is not indicative of future results.
The strategy uses margin (up to 1.5× gross leverage) and can lose more than the amount invested in a single position; the simulated worst fall was about −18% (2021–2026), about −20% if every stop-loss had filled at the next open, the longest stretch below a prior equity peak lasted about 18 months, and future falls can be deeper and longer.
About 4 out of 5 trades lose a small amount; returns depend on a small number of large winners. Extended periods of flat or negative performance are normal.
Know the risk
The risk, in plain terms
Most trading websites tuck this part into small print at the bottom. We keep it right beside the performance numbers, because both belong to the same record. And none of it has to be learned the hard way: the free paper mode exists so you can watch every one of these behaviors play out with simulated money first.
Most trades lose
About 4 out of 5 trades lose a small amount; returns depend on a small number of large winners. Extended periods of flat or negative performance are normal.
It trades on margin
The strategy uses margin (up to 1.5× gross leverage) and can lose more than the amount invested in a single position; the simulated worst fall was about −18% (2021–2026), about −20% if every stop-loss had filled at the next open, the longest stretch below a prior equity peak lasted about 18 months, and future falls can be deeper and longer.
Losing streaks last months
The longest simulated run without a single winning trade was 32 consecutive trades, and the account spent about 18 months below a prior peak. Turning the system off mid-streak keeps the losses and misses the recoveries.
Simulations are not promises
The published backtest results are simulations. They do not represent actual trading, do not capture every cost or market condition, and are not a forecast of your account.
How it works
What the program does on your PC, every trading day
A list of 15 US stocks
Every week the Nexus server builds a watchlist of 15 US stocks using momentum, trend, and fundamental screens, and your program downloads it as one cryptographically signed bundle — identical for every user. If the bundle is missing or invalid, the program takes no new entries and emails you.
Stops watched from before dawn
Your PC wakes and the program starts monitoring existing protective stops in extended hours. Software updates are checked here too — they apply only on the next start, never mid-session.
One decision cycle a day
The single daily decision: up to 4 new entries (at most 14 positions), stop adjustments, and risk checks. Every position is protected by a hard stop-loss order resting at the broker — it stays in force even if your PC dies.
An email so you know
A daily summary lands in your inbox every trading evening, and a monthly statement on the 1st. You can also see everything directly in Interactive Brokers at any time — it is your account.
What it is not
Software you run — nothing more
- Not a managed account. Nobody at Nexus manages your money or supervises your trading. The software runs on your machine, on your account, at your decision.
- Not investment advice. Every subscriber receives the same weekly data. The software knows nothing about your finances, objectives, or suitability, and no one at Nexus makes recommendations to you.
- Not custody. Money never leaves your own Interactive Brokers account. The software never sees your broker password — it talks to your own logged-in trading workstation on the same PC.
- Not a signal service. There is nothing to copy by hand. The program executes its published rule set automatically, or it does nothing.
Requirements
What you need before day one
| Broker account | Interactive Brokers margin account, dedicated to Nexus Trader — the program adopts and manages every position it finds in the account |
|---|---|
| Account size | minimum CAD 5,000 · recommended CAD 7,000+ |
| Market data | Live US market-data subscription at IBKR (≈ US$5–15/month; delayed data is not sufficient) |
| Computer | Windows 10/11 PC, on and awake 04:00–20:00 ET on trading days (the installer disables sleep on AC power) |
| Broker software | IBKR Trader Workstation (TWS) running with API access enabled; IB Key two-factor renewals are yours to complete |
| An address for alerts, daily summaries, and monthly statements |
Why the minimum: the measured failure point is near CAD 3,000 — position sizing rounds toward zero shares and the strategy stops working; CAD 5,000 sits safely above it. This is a measured floor, not a marketing number.
Pricing
One number: 0.10% of your monthly average, per month
Paper is free, with no time limit. The monthly fee applies only when you choose to trade live — until then there is nothing to pay and no card on file.
monthly fee = monthly average account equity ÷ 1,000
Each month the software averages your account's daily equity (the broker's net liquidation value, in CAD) and the fee is that average divided by 1,000 — 0.10% per month. You receive a statement showing the full calculation at least 10 days before every charge.
- No minimum fee, no maximum fee, no performance fee, no per-trade fee.
- Paper (simulated) mode is free with no time limit — no card required.
- Live trading is enabled per account by Nexus, after your paper phase and the Live Trading Risk Acknowledgment — the software does not trade a live account before that, and the fee starts only then.
- If payment lapses, the software stops opening new positions — it never liquidates your account for non-payment.
- Cancel any time from the billing portal or by email; the plan ends at the end of the billing month with no termination charge.
A candid fit check
Who it fits — and who it doesn't
It fits patient investors who want a rules-based process they can verify against published data, and who can leave it running through the losing streaks the simulated history contains. In fairness, it is not for:
- Anyone who cannot afford to watch their account fall 25% or more and stay below its peak for a year or longer.
- Anyone who would switch the system off after ten losing trades in a row — streaks of twenty or more are part of normal operation.
- Anyone who needs the money within a few years, or is trading savings they cannot afford to lose.
- Anyone who wants someone else to be responsible. You remain the account holder, with full authority and the duty to supervise your own account.
Getting started
Three steps, in order
Broker setup
Open a dedicated IBKR margin account, add US-stock permissions and the live market-data subscription, and install TWS. Account opening takes one to two weeks — it is the long pole.
Install & run on paper
Install Nexus Trader, connect it to your paper account, and let it run simulated sessions until you have seen its daily rhythm with your own eyes — entries, stops, summaries. This stage is free and has no time limit.
Acknowledge the risk, go live
Before real money, the software requires you to individually accept each item of the Live Trading Risk Acknowledgment inside the app. Only then does live trading unlock — and it stays your decision every day after.
FAQ
Fair questions
Do you ever touch my money?
No. Your money stays in your own Interactive Brokers account. The software never sees your broker password — it connects to your own logged-in TWS on the same PC — and Nexus has no mechanism to move funds, place orders remotely, or liquidate anything in your account.
Can I lose more than I put in?
The strategy uses margin (up to 1.5× gross leverage), so a position can lose more than the amount you mentally allocated to it, and account-level losses can exceed the simulated history. If you cannot accept that sentence, do not go live.
What happens if my PC crashes mid-trade?
Every position is protected by a hard stop-loss order resting at the broker, not on your PC. If your computer dies, the stops remain in force at IBKR, and you can manage the account directly in TWS or on your phone at any time.
What data leaves my computer?
Licensing data (a one-way pseudonymous token for the account your license is bound to — never the full account number — plus its last 4 characters, your PC's name, and one-way-hashed device fingerprints), minimal status emails relayed through our server — by default just a generic category line, with the detailed content saved to a file on your own PC — and ordinary server connection logs (IP address and time). No usage analytics, no tracking, never your broker credentials. The Privacy Policy lists every flow.
Why does the win rate matter less than it seems?
Because the strategy is built on a right tail: about 4 of 5 trades lose a small, controlled amount (the simulated win rate was 22.4%), and the few winners are large — the average winner was about 6.0× the average losing trade in simulation, and the ten largest winners carried 73% of net profit. Judging it on any individual trade, or any individual month, measures the wrong thing.
Can I stop it whenever I want?
Yes. You can stop new entries with one switch, stop the program entirely, or act directly at the broker at any moment — it is your account, and the software never has more authority than you do. Remember that stopping mid-losing-streak is how the losses are kept and the recoveries are missed.